
Connecting Grafana to Ntfy: From Emails to Cloudflare Workers
In this guide, we’ll explore how to bridge the gap between Grafana’s built-in Alertmanager and Ntfy. We will cover three distinct methods to send alerts: via email, via a standard webhook, and finally, via a Cloudflare Worker—a method that unlocks significantly more customization for your notifications.
Prerequisites
This guide assumes you are running a self-hosted instance of Grafana and targeting the public instance of Ntfy at ntfy.sh.
Grafana
Grafana is the industry-standard open-source platform for visualizing data. It builds modular dashboards and panels by pulling information from a wide variety of data sources.
The ecosystem for collecting metrics is vast, including:
-
Prometheus: Fetches data from services, Docker containers (via cAdvisor), server core metrics (node-exporter), S.M.A.R.T. disk metrics, Postgres, Mongo, and more.
-
Loki: Handles log aggregation, including system logs, journals, and Docker logs.
-
Infinity Datasource: Connects to practically any API, CSV, or JSON file.
-
And many others: Native integrations for Google Analytics, Cloudflare, Elasticsearch, GitHub, etc.
I won’t dive into the configuration of these data sources here, as it depends heavily on your specific stack. Personally, I use Grafana to monitor server health (CPU, I/O, disk, temperature), service uptime via Blackbox, and Docker container stats. I also maintain dedicated dashboards for Postgres, MongoDB, Traefik, Plausible Analytics, and my Garage cluster.
The possibilities are nearly limitless. The list of native data sources is impressive and can be expanded via the Grafana Plugin Catalog. Want to visualize your Strava runs? There’s a plugin for that. Need Jira statistics? There’s a plugin for that too.
While dashboards are great for visualizing infrastructure health, they don’t proactively alert you to issues—like a sudden spike in 5xx errors or a memory leak. Unless you have someone staring at screens 24/7, relying solely on visual checks is not sustainable.
The real power of monitoring lies in Alerting. Grafana allows you to define rules based on your metrics via the Alertmanager. While standalone Alertmanager services exist for Prometheus or Mimir (offering greater resiliency for enterprise setups), the Grafana built-in Alertmanager is the easiest way to start. It is perfectly suited for homelabs and agile teams.
Example: To monitor my Garage cluster, I use the cluster_healthy metric (1 for healthy, 0 for unhealthy). I created an alert rule that triggers when the query drops below 1. In the “Configure notifications” section, you can set triggers via Email, Discord, Slack, etc., or via Webhook—which is what we need for Ntfy.
Ntfy
Ntfy is a fantastic open-source tool that sends notifications to your phone or desktop via simple API calls. Use cases range from backup failure alerts to “back in stock” notifications.
We will use Ntfy to receive push notifications whenever a Grafana alert fires or resolves.
The public version (ntfy.sh) offers a generous free tier (capped at 250 messages/day), which is more than enough for this use case. For higher limits or private topics, you can subscribe to a premium plan or self-host your own instance.
I highly recommend reading the official documentation to understand the full capabilities.
Preparation: Create an account on ntfy.sh and subscribe to a topic (e.g., my-secret-grafana-topic). Note this topic name down; we will need it immediately.
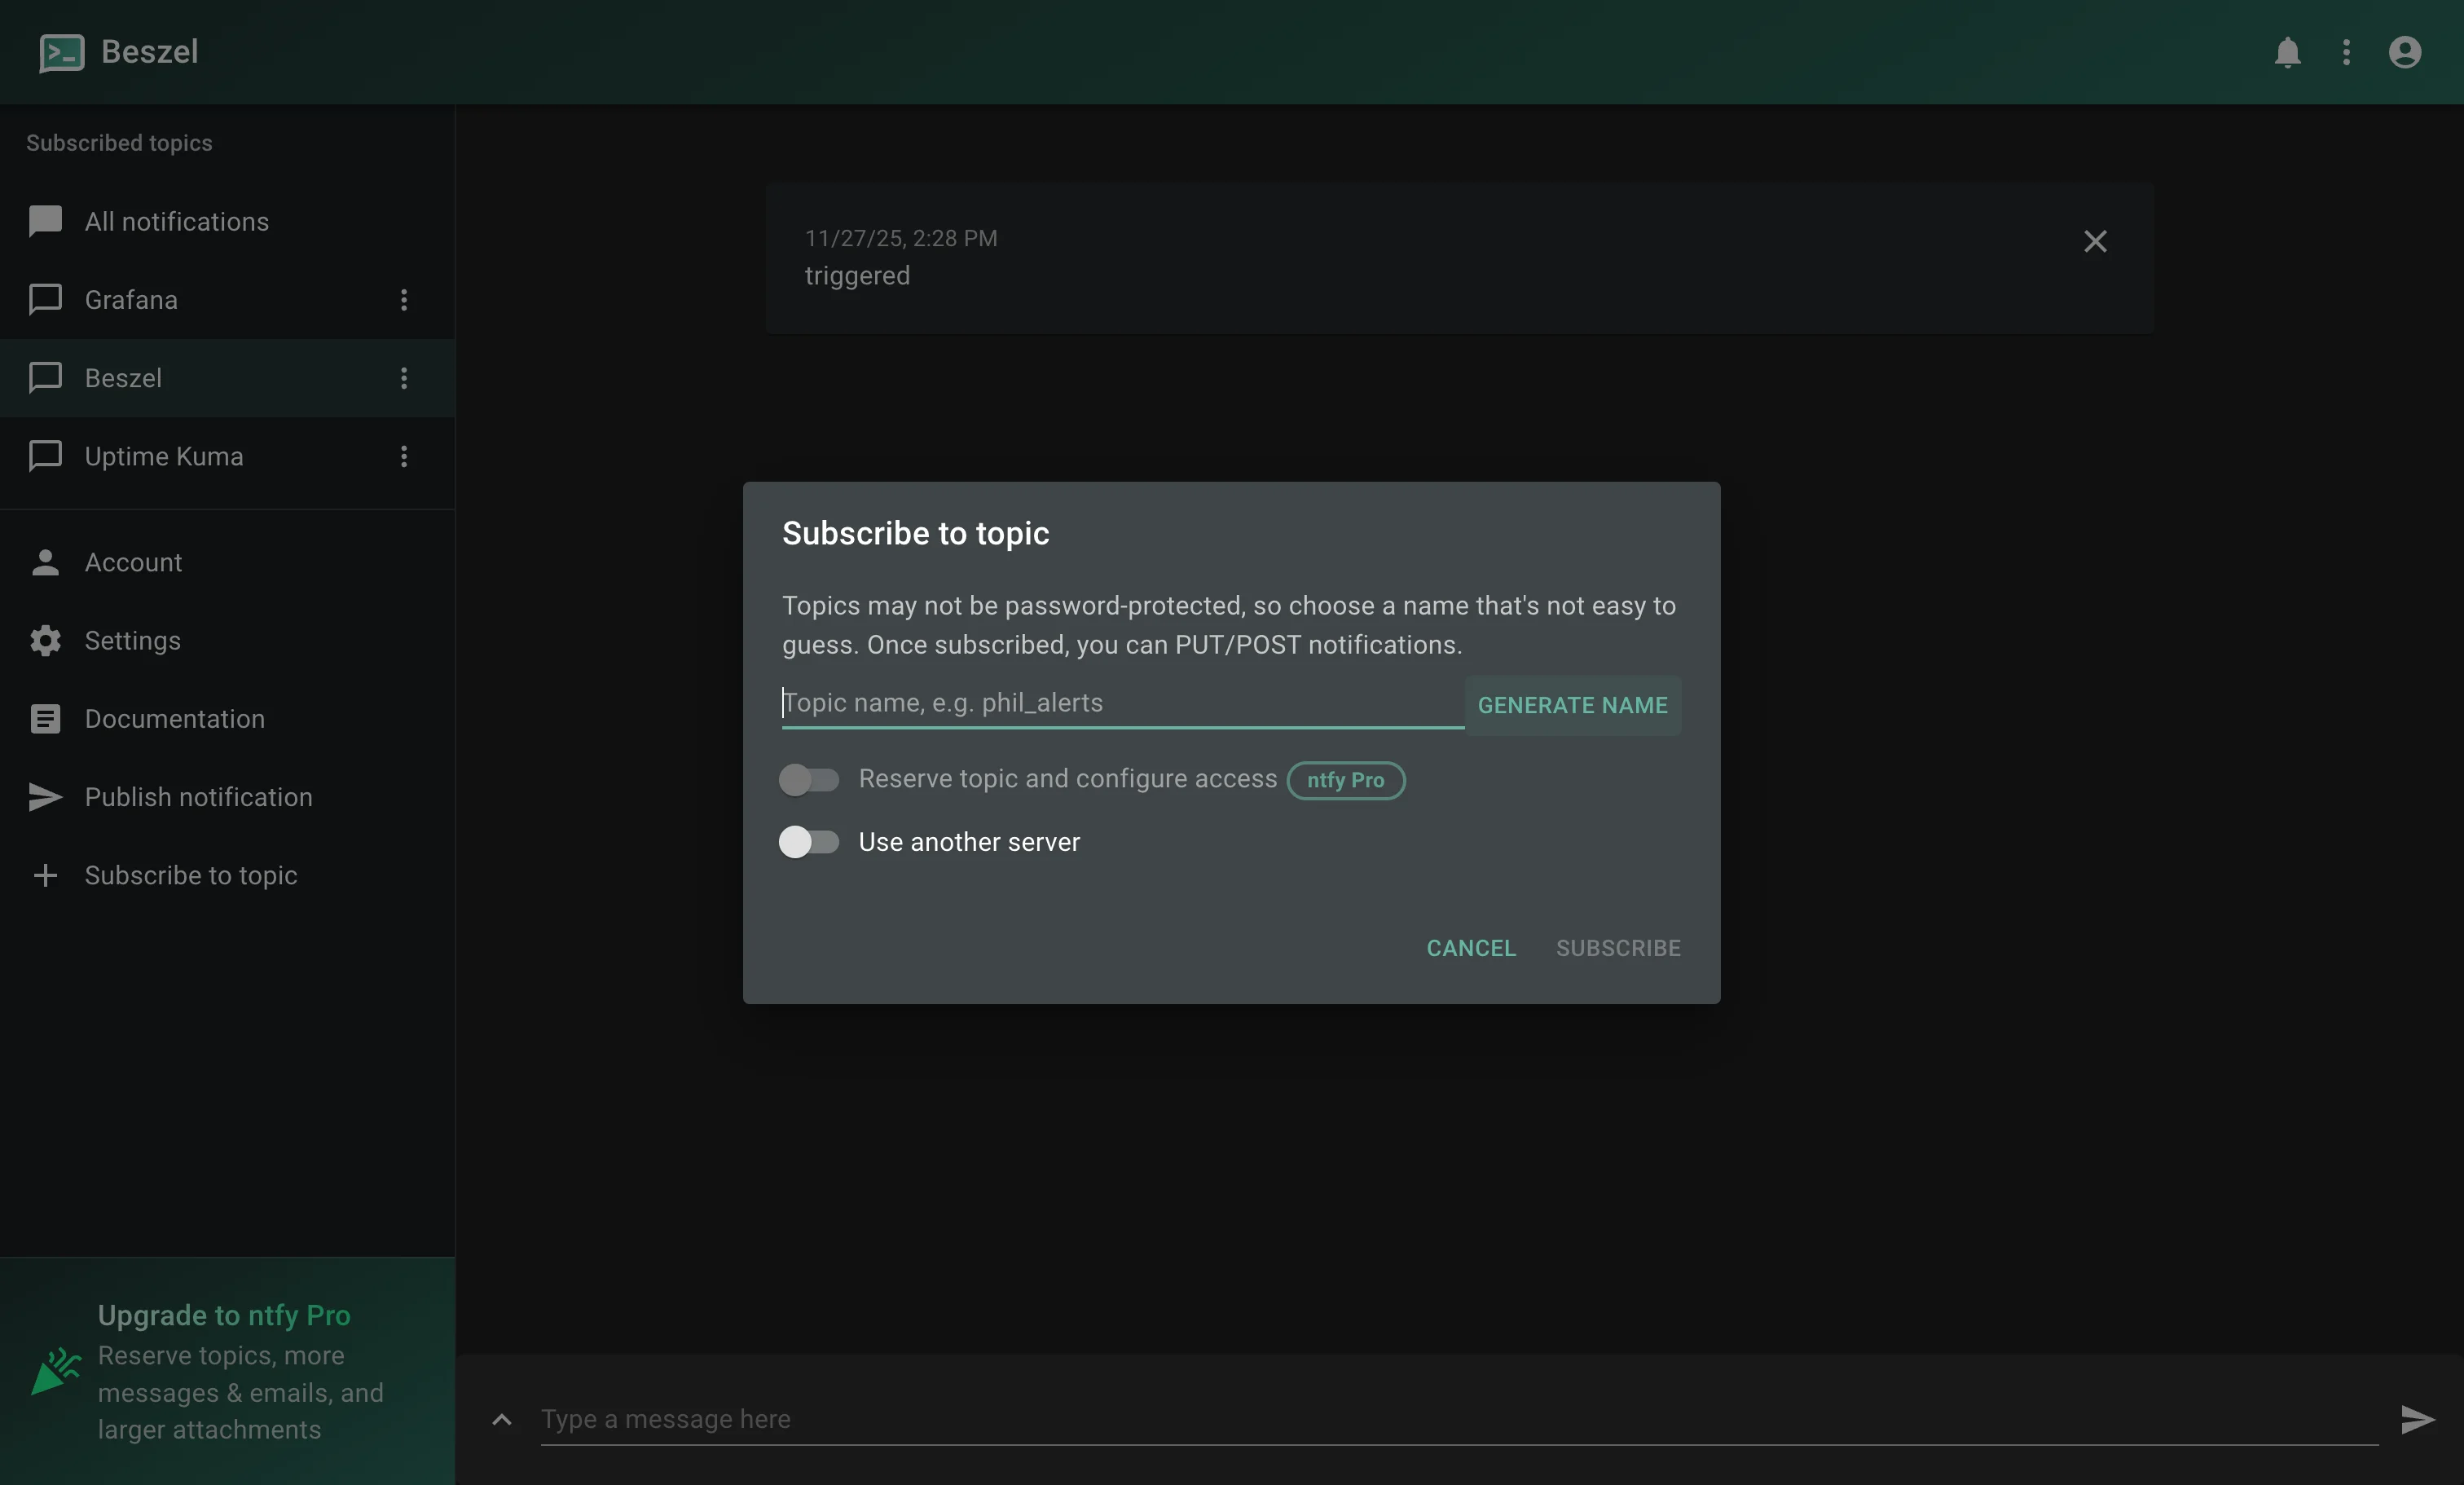 Topic creation on ntfy
Option 1: Via Webhook (The Simple Way)
Once your Ntfy topic is ready, setting up a Contact Point in Grafana is straightforward:
-
Navigate to Alerting > Contact points > + Create Contact point.
-
Select Webhook from the Integration dropdown.
-
In the URL field, enter
https://ntfy.sh/${topic}, replacing${topic}with your topic name.
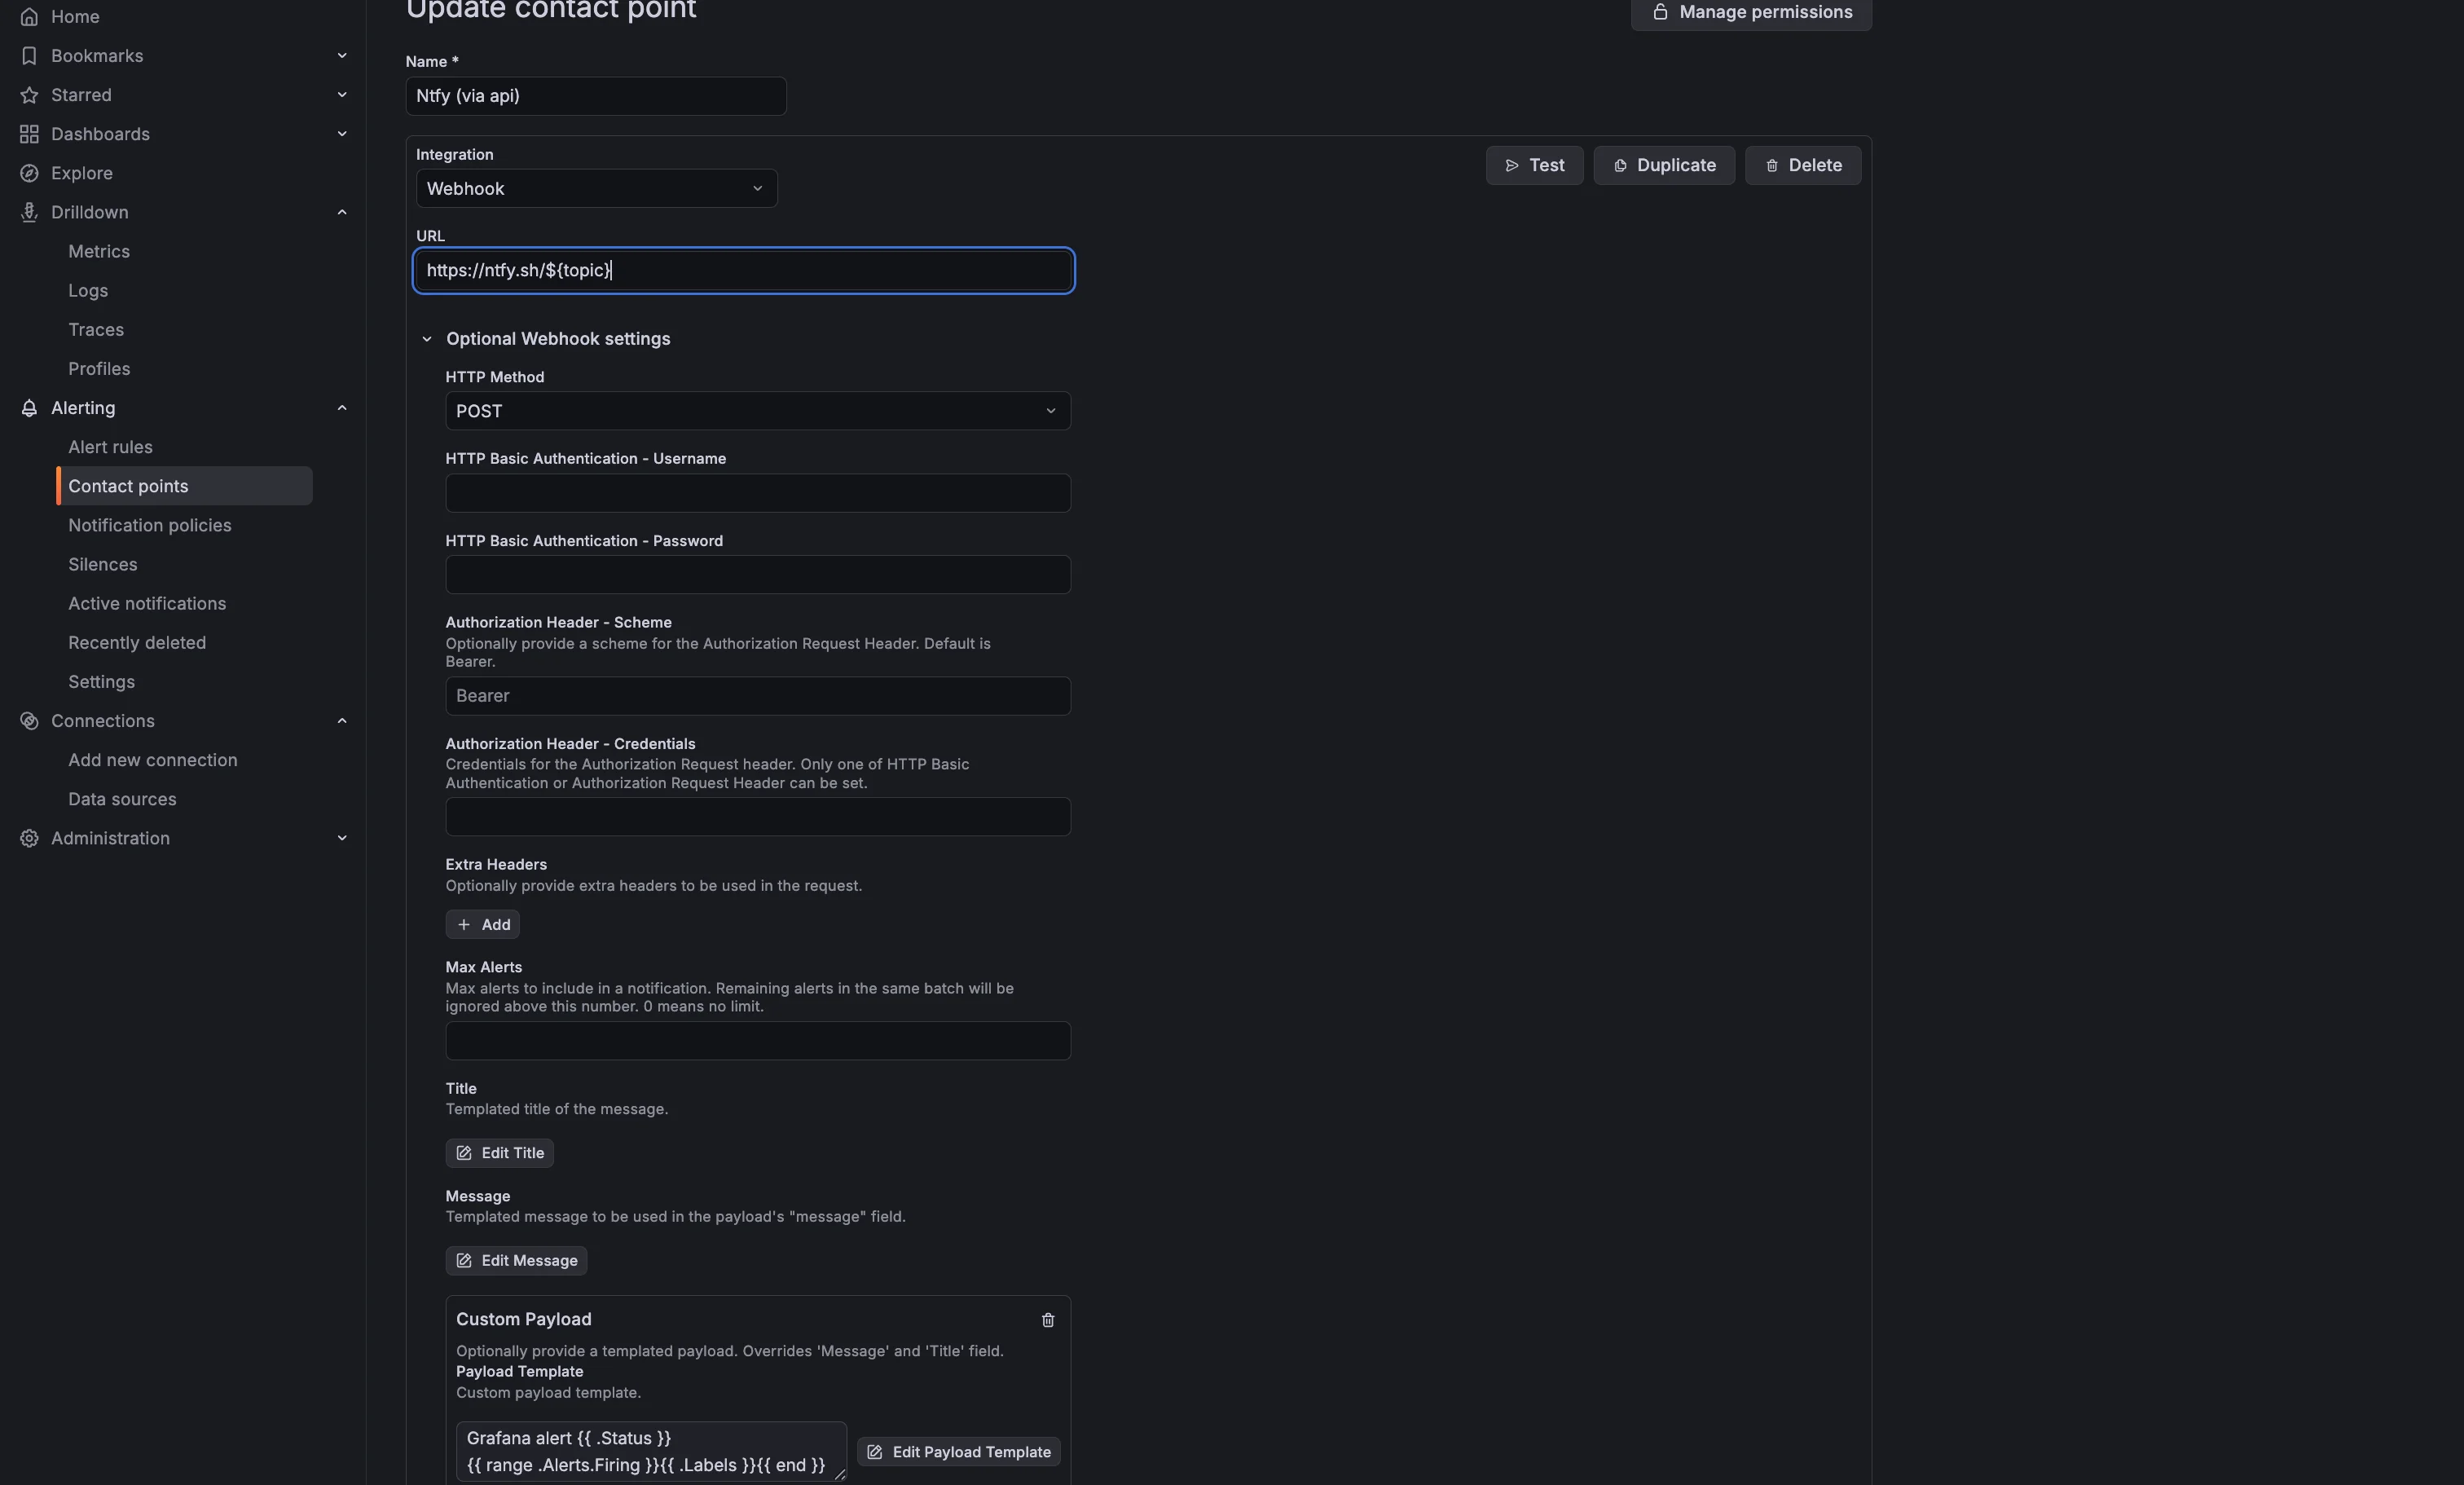 Grafana contact point, with webhook to Ntfy
Grafana allows you to inject alert data into the payload using templates. Edit the “Custom Payload” field to structure your message. For example:
Grafana alert {{ .Status }}
{{ range .Alerts.Firing }}{{ .Labels }}{{ end }}
Clicking “Test” should trigger a notification on your device:
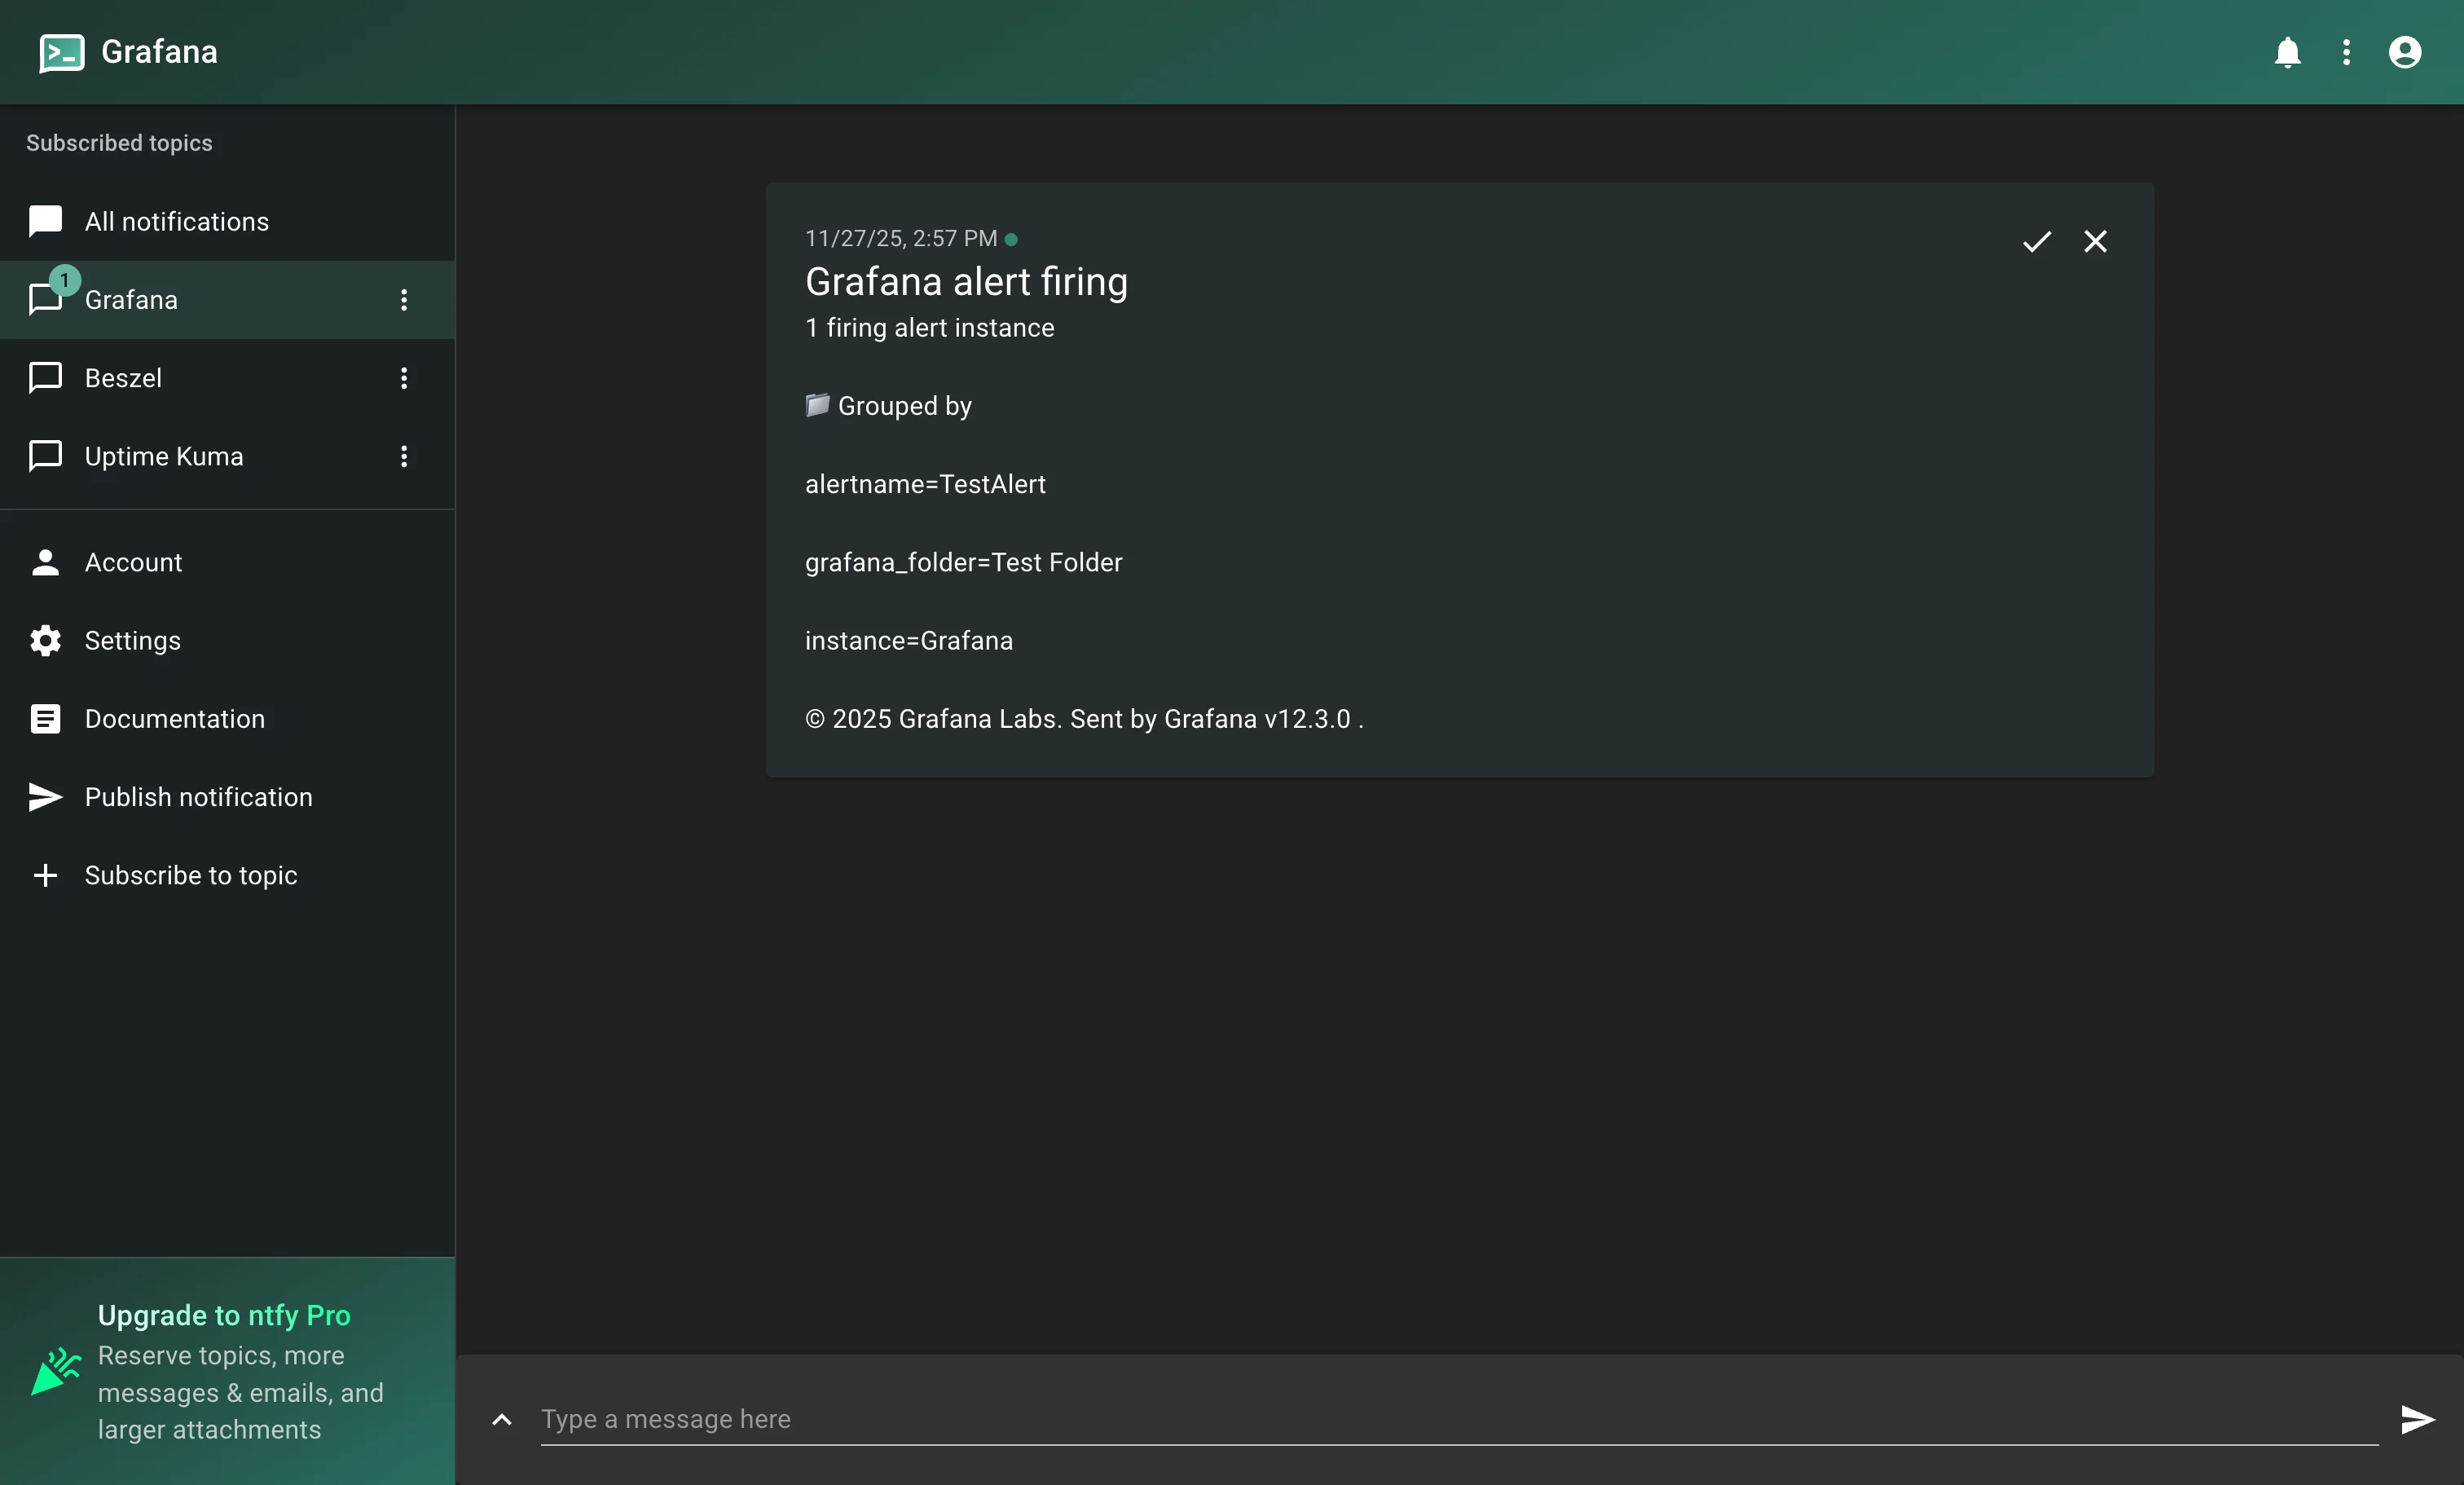
Grafana alert firing
alertname=TestAlert, grafana_folder=Test Folder, instance=Grafana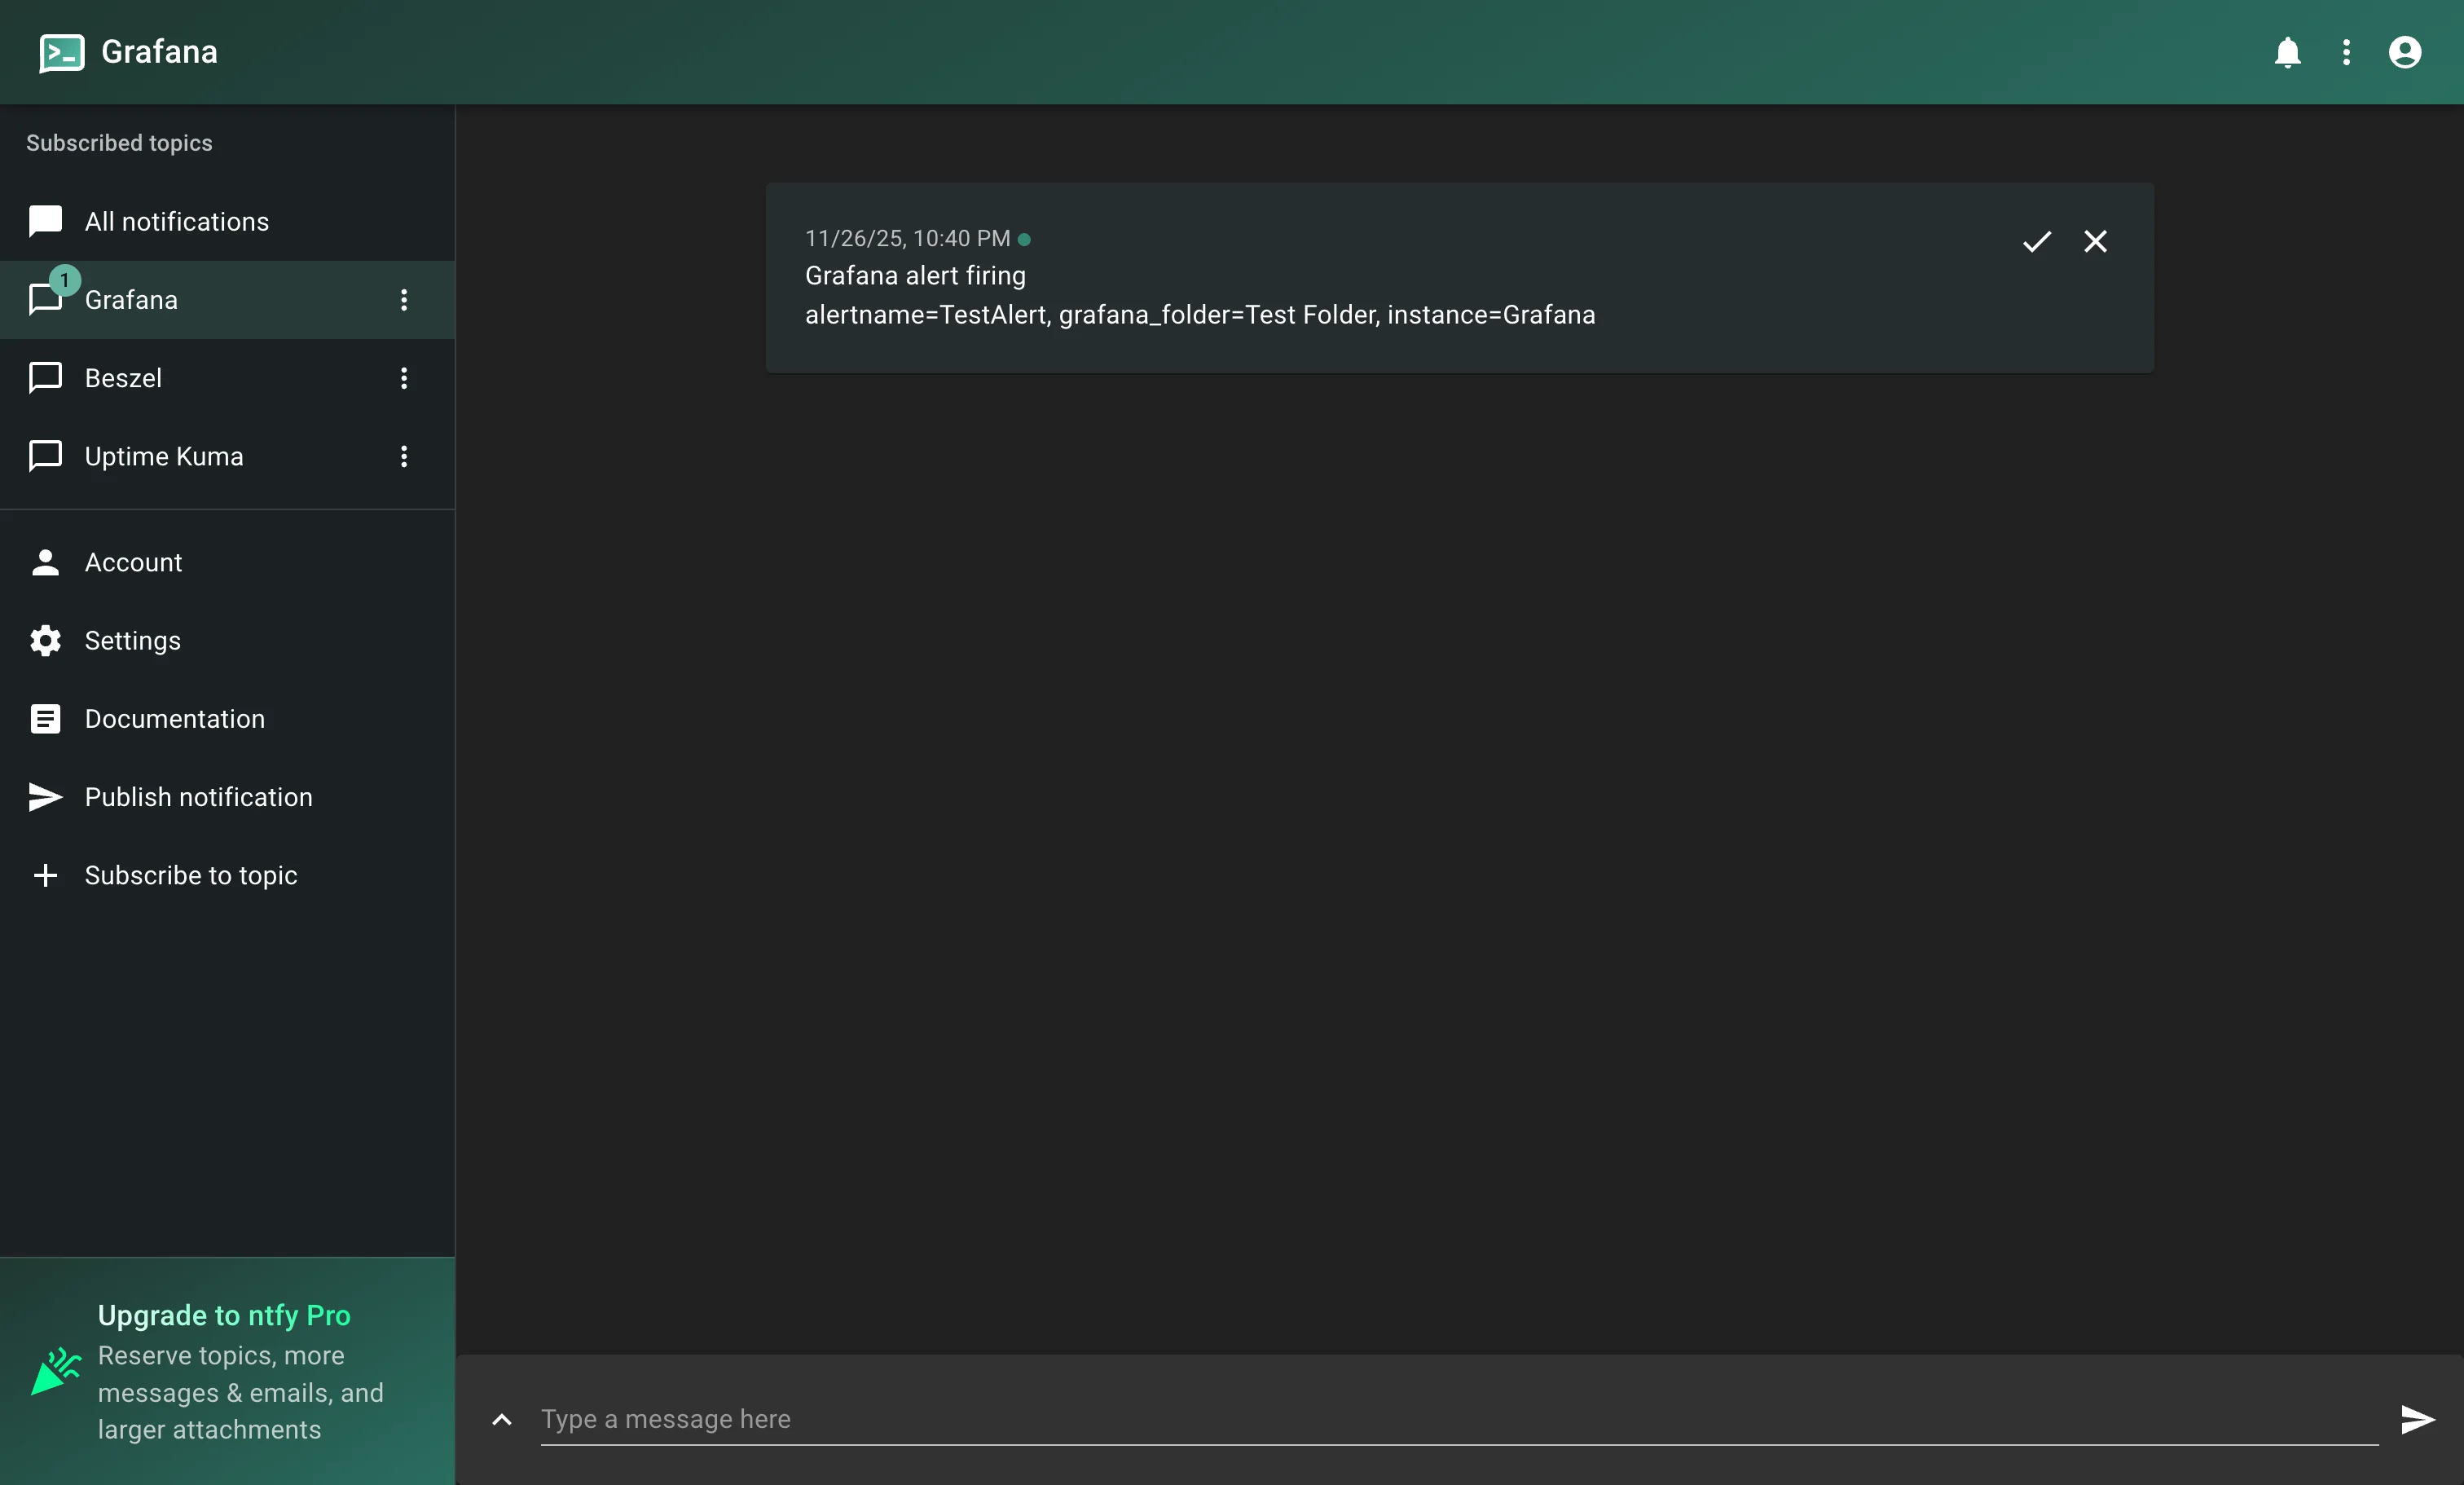 Notification received using ntfy api
It works, but the formatting is raw and utilitarian.
Option 2: Via Email
To send notifications via email, you must first configure SMTP in Grafana. Detailed instructions can be found here.
I use a Gmail account for this. You will need to generate an App Password (see guides here and here).
My grafana.ini SMTP configuration looks like this:
[smtp]
enabled = true
host = smtp.gmail.com:587
user = <example>@gmail.com
password = <password>
from_address = grafana@example.com
from_name = Grafana
After restarting Grafana:
-
Go to Alerting > Contact points > + Create Contact point.
-
Select Email.
-
In the Addresses field, use the Ntfy email format:
ntfy-${topic}@ntfy.sh.
Unlike the webhook method, we can easily set a clean title using the Subject field:
Grafana alert {{ .Status }}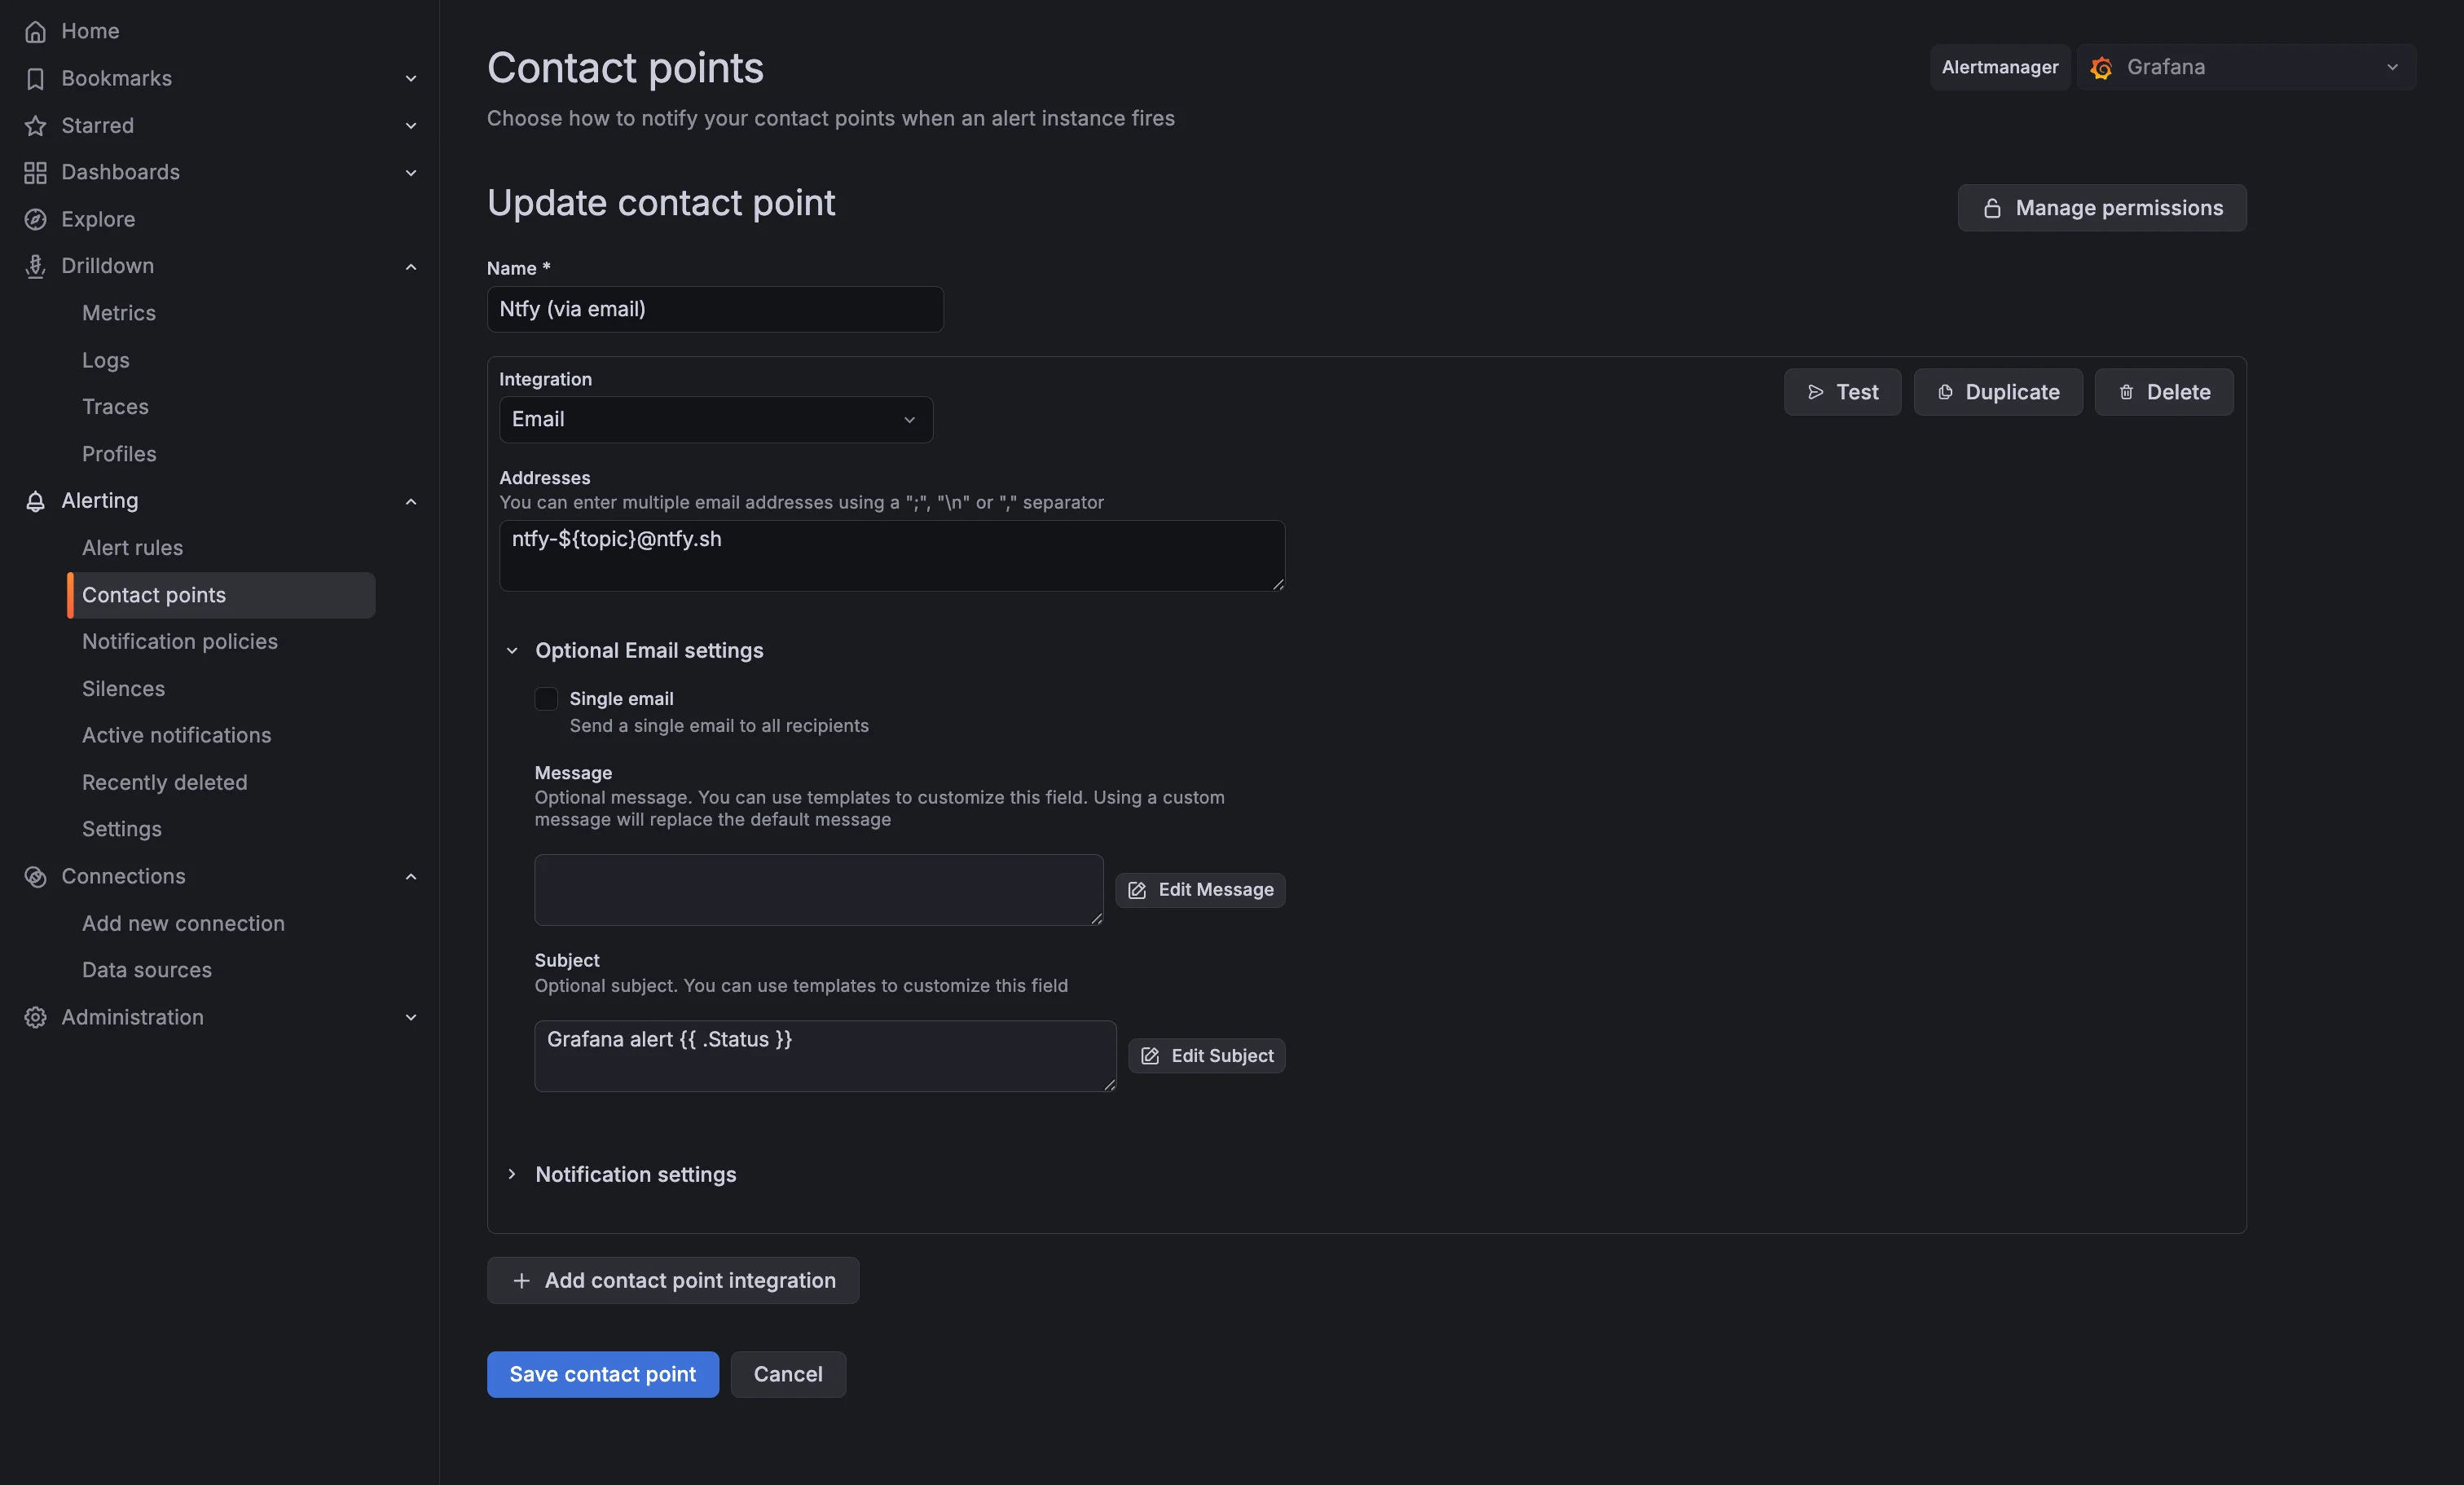 Grafana contact point, with email to Ntfy
The downside: You lose control over the message body. Grafana appends default metadata, making the notification verbose. I usually place a single whitespace in the message field to minimize clutter, but the result still contains footers and headers.
 Notification received using emails
Option 3: Webhook + Cloudflare Worker (The “Pro” Way)
Why use a Worker?
The first two options are easy but rigid. Grafana’s native webhook configuration doesn’t allow you to dynamically parameterize headers based on alert data (e.g., changing the priority header based on the alert severity).
By introducing a “middleware”—a Cloudflare Worker—we can intercept the payload, process the logic, and construct the perfect API call for Ntfy. This enables:
-
Actionable notifications: Add buttons to open dashboards directly.
-
Dynamic Priorities: High priority alerts trigger loud sounds; low priority alerts are silent.
-
Visual Tags: Use emojis to instantly distinguish between
Firing(🔥) andResolved(✅).
Configuring the Worker
-
Log in to Cloudflare and go to Compute (Workers) > Create application.
-
I recommend connecting to a GitHub repository for version control. You can fork or use my repository here.
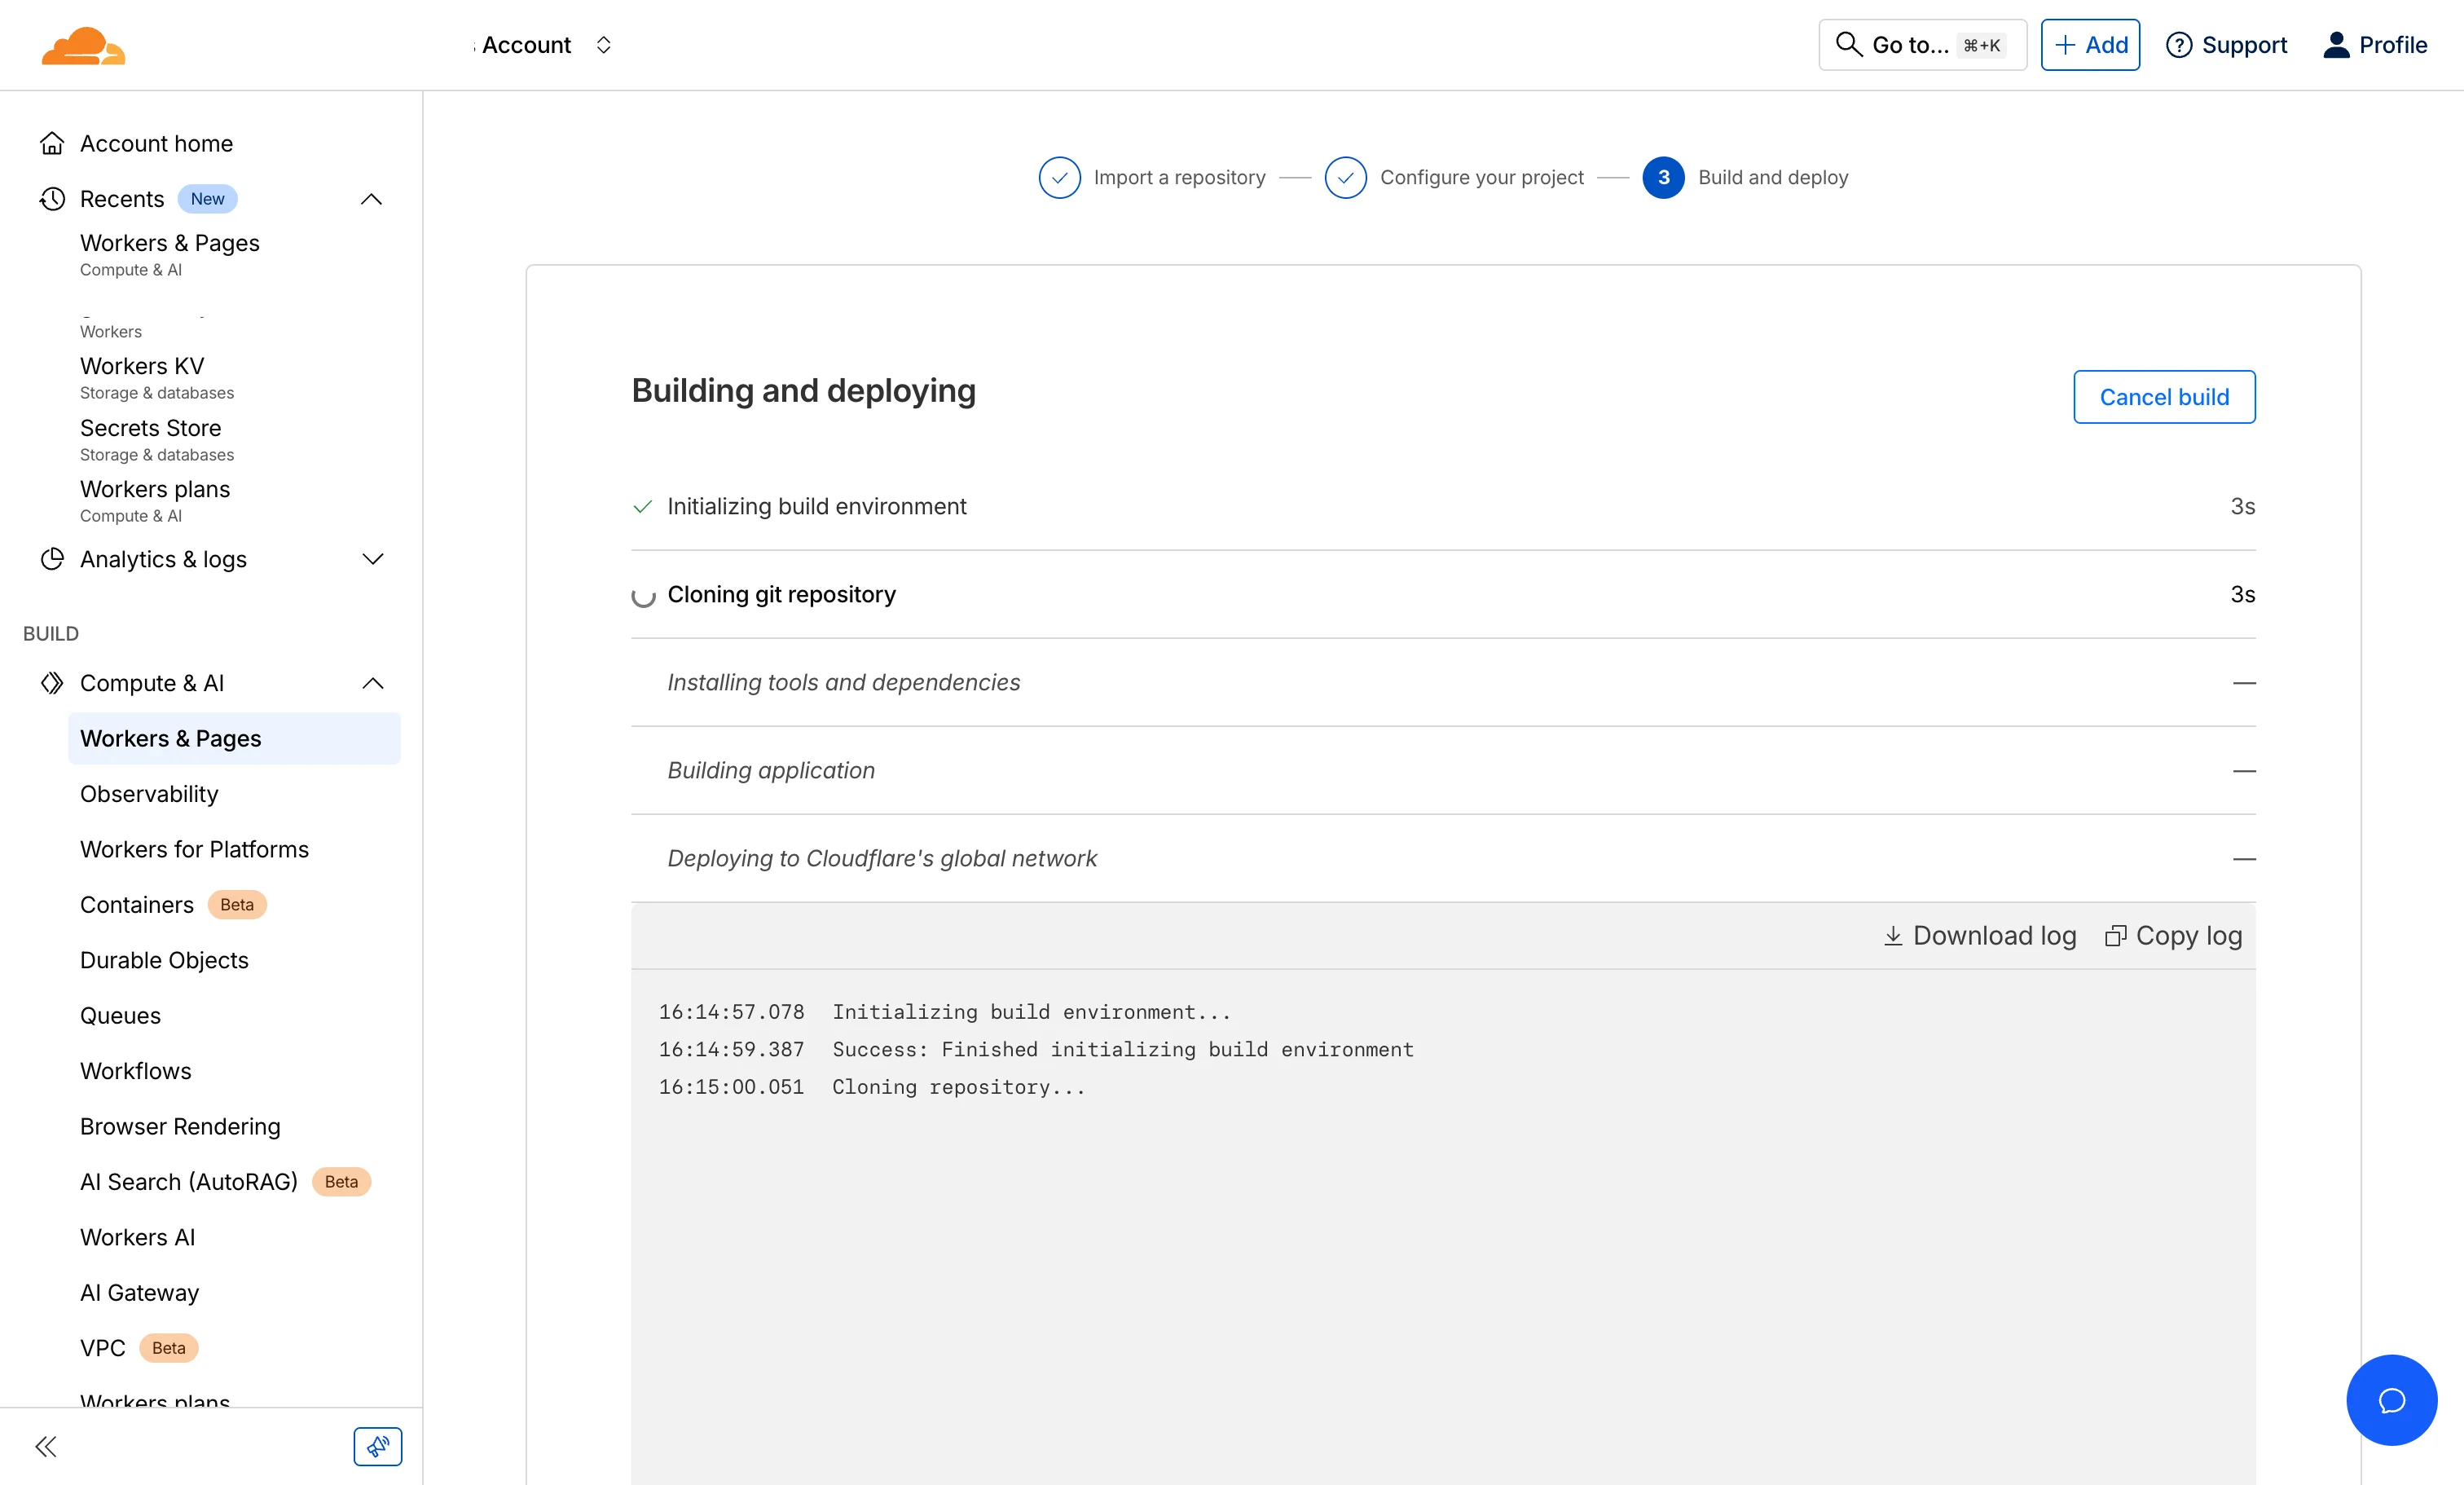 The worker’s build and deployment screen on Cloudflare
Once deployed, define two secrets in the Worker’s settings:
-
AUTH_TOKEN: A secure string (generate one via
openssl rand -base64 20) to secure the link between Grafana and Cloudflare. -
TOPIC: Your Ntfy topic name.
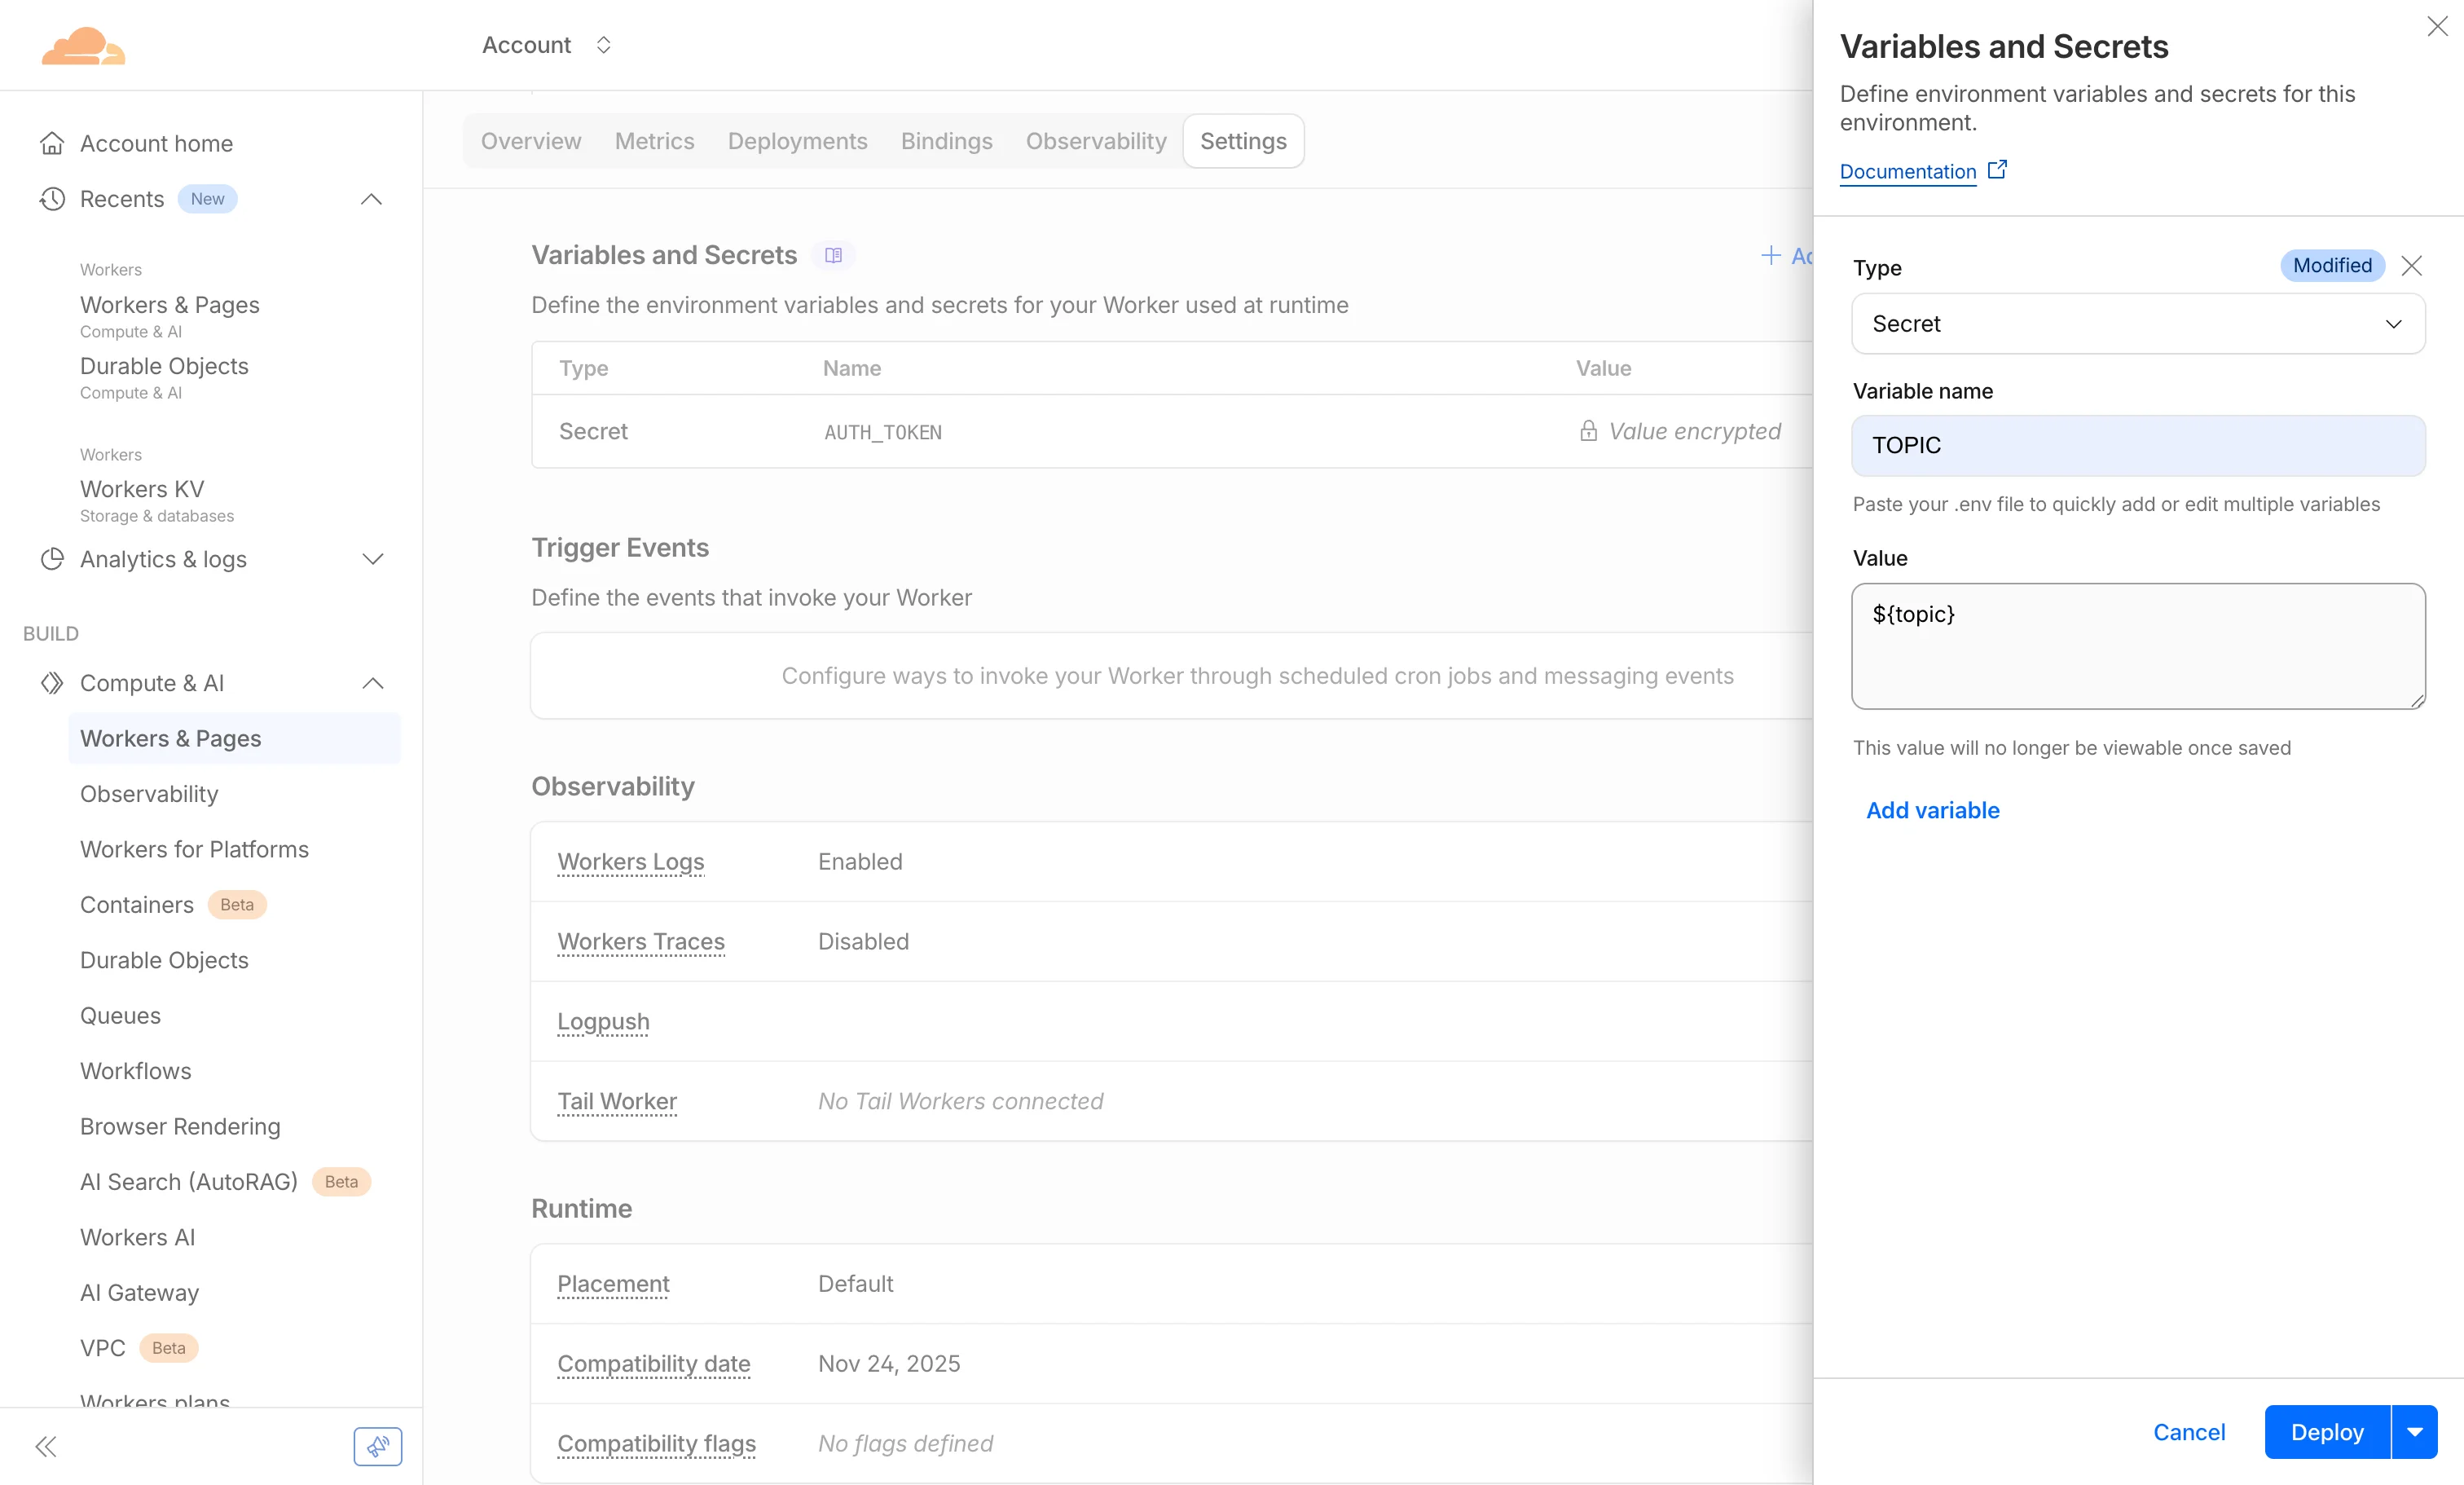 The worker’s secret creation panel
Configuring Grafana
Back in Grafana:
-
Create a new Webhook contact point.
-
URL: Your Cloudflare Worker URL (
https://your-worker.subdomain.workers.dev). -
HTTP Method: POST
-
Authorization Header Scheme: Bearer
-
Authorization Header Credentials: The
AUTH_TOKENyou generated. -
Message: Select “Enter custom message” and paste the JSON block below.
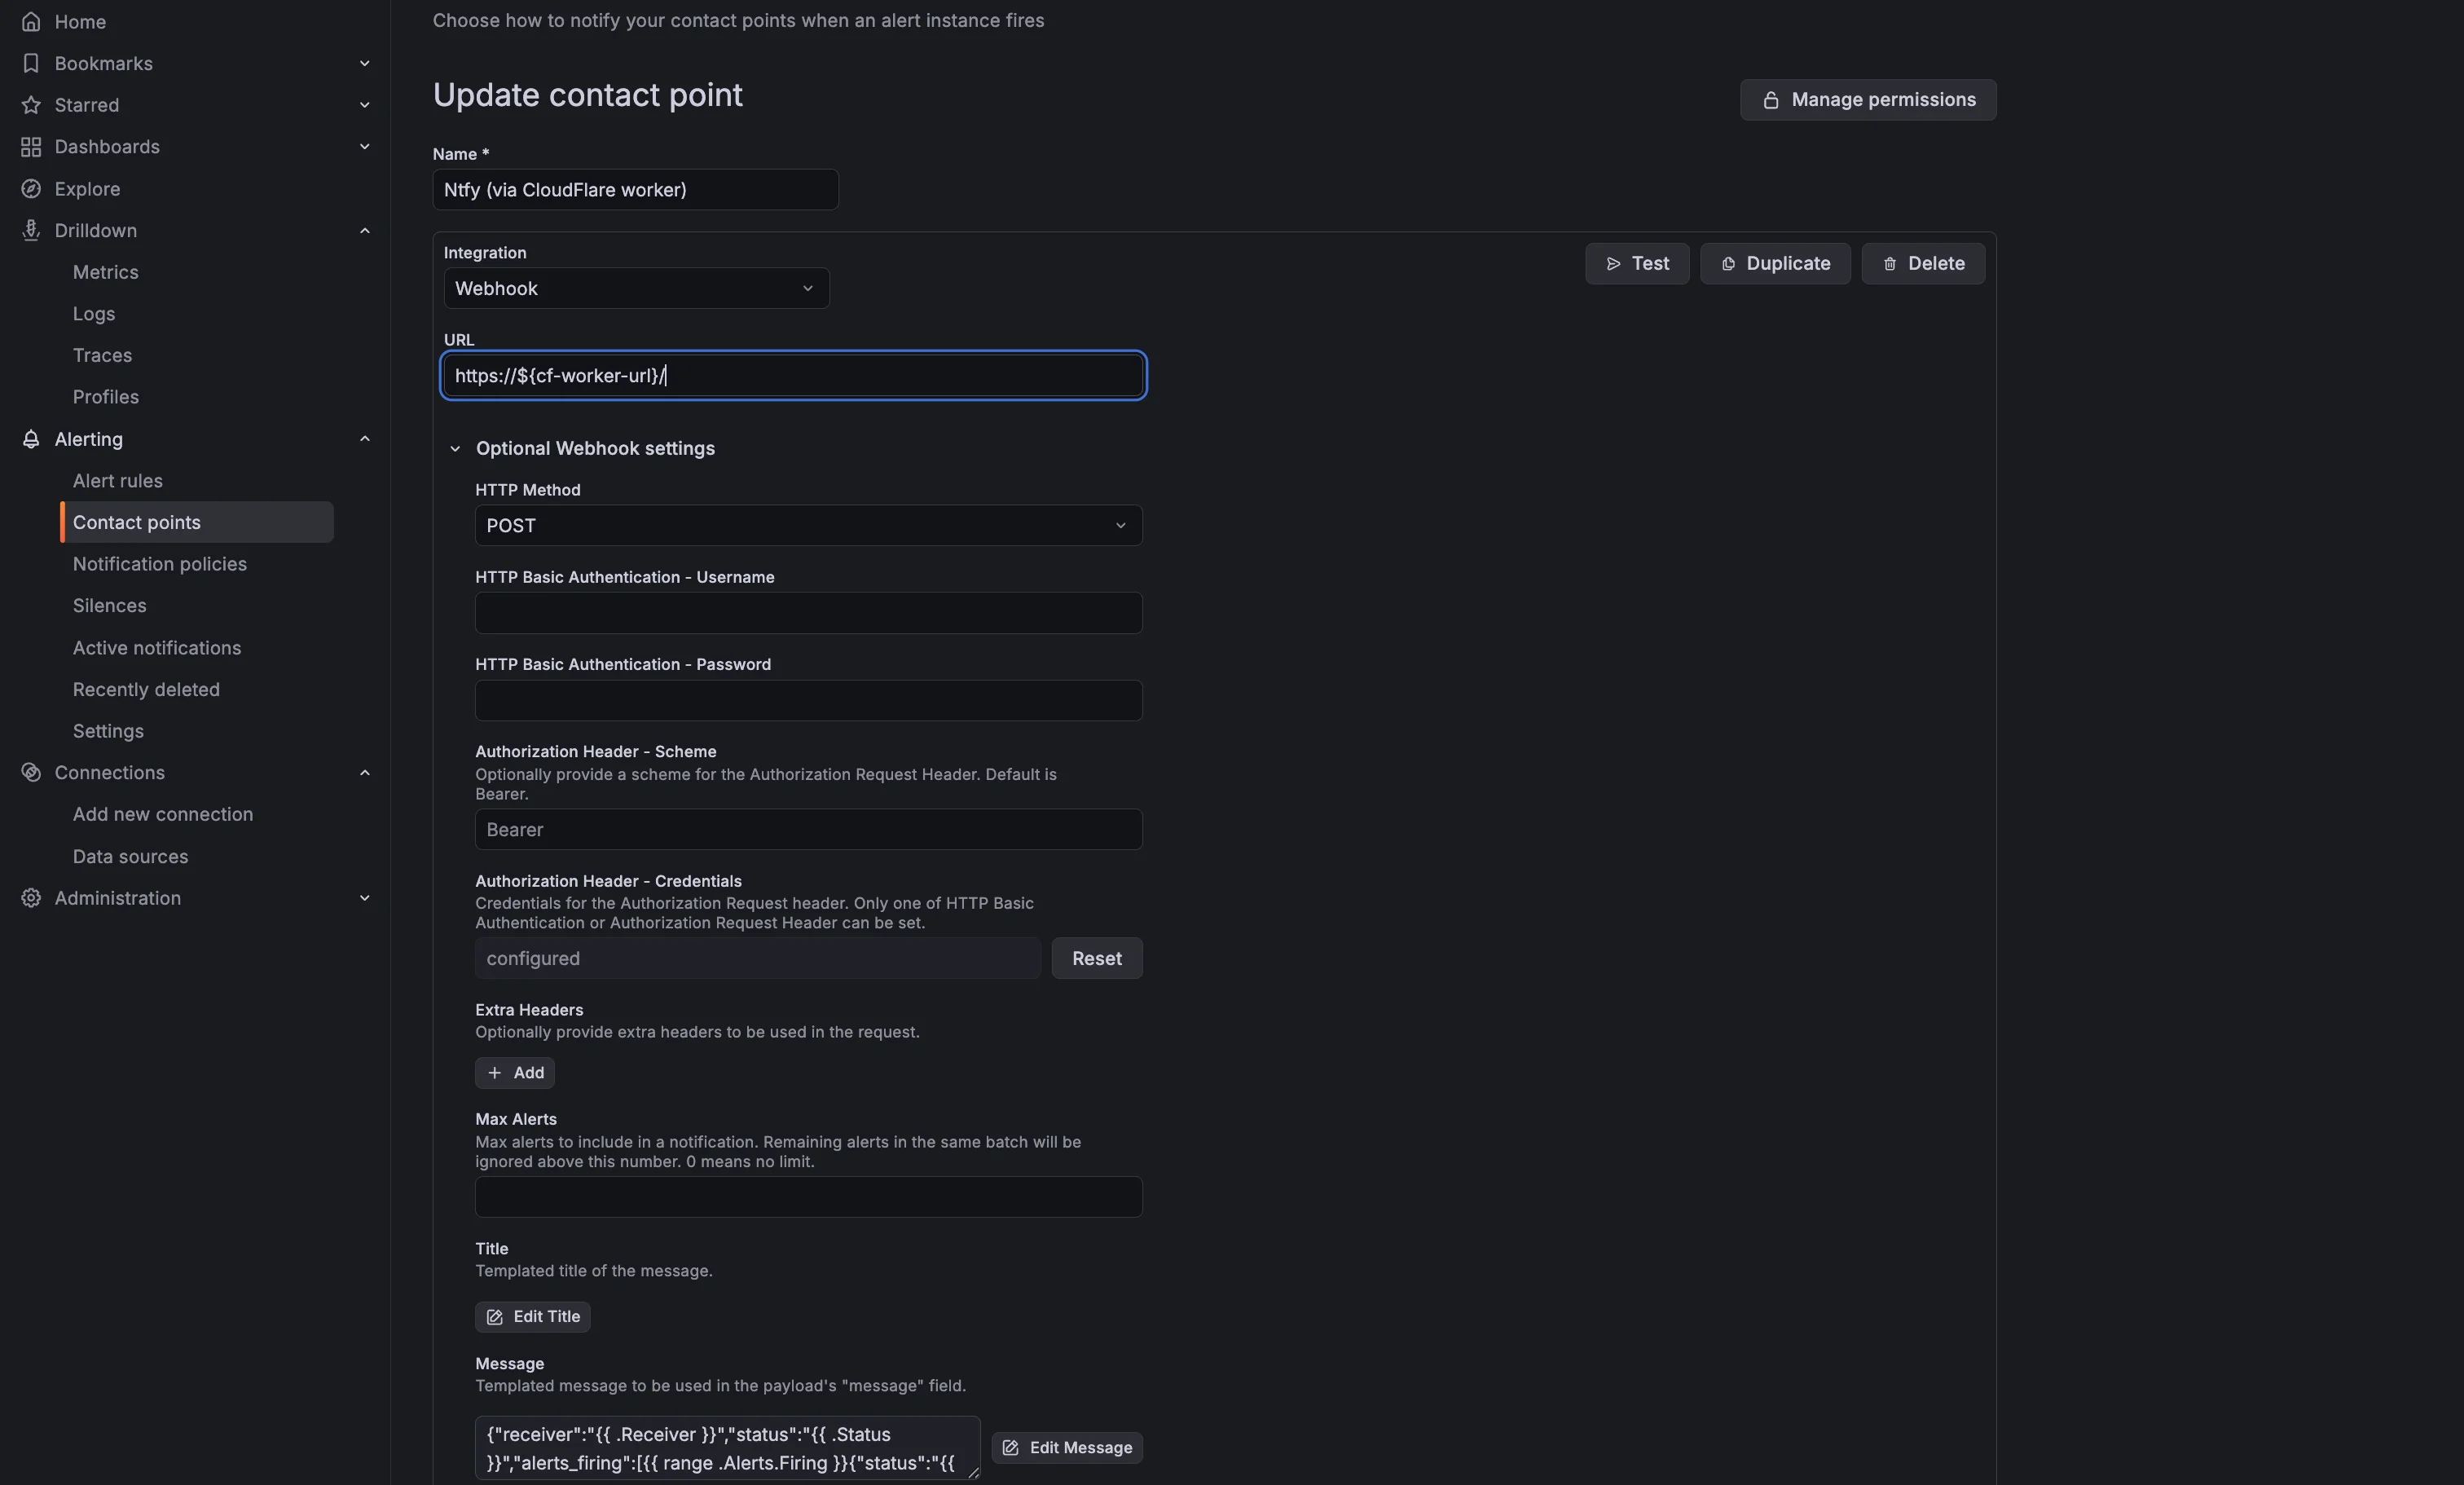 Grafana contact point that uses the Cloudflare worker
Note: This JSON is a single-line template that extracts all relevant data conforming to the structure my Worker expects.
{"receiver":"{{ .Receiver }}","status":"{{ .Status }}","alerts_firing":[{{ range .Alerts.Firing }}{"status":"{{ .Status }}","labels":"{{ .Labels }}","annotations":"{{ .Annotations }}","starts_at":"{{ .StartsAt }}","ends_at":"{{ .EndsAt }}","generator_url":"{{ .GeneratorURL }}","fingerprint":"{{ .Fingerprint }}","dashboard_url":"{{ .DashboardURL }}","panel_url":"{{ .PanelURL }}","silence_url":"{{ .SilenceURL }}","values":"{{ .Values }}","value_string":"{{ .ValueString }}"}{{ end }}],"alerts_resolved":[{{ range .Alerts.Resolved }}{"status":"{{ .Status }}","labels":"{{ .Labels }}","annotations":"{{ .Annotations }}","starts_at":"{{ .StartsAt }}","ends_at":"{{ .EndsAt }}","generator_url":"{{ .GeneratorURL }}","fingerprint":"{{ .Fingerprint }}","dashboard_url":"{{ .DashboardURL }}","panel_url":"{{ .PanelURL }}","silence_url":"{{ .SilenceURL }}","values":"{{ .Values }}","value_string":"{{ .ValueString }}"}{{ end }}],"group_labels":"{{ .GroupLabels }}","common_labels":"{{ .CommonLabels }}","common_annotations":"{{ .CommonAnnotations }}","external_url":"{{ .ExternalURL }}"}Click Test. You should receive a beautifully formatted notification with proper tags, priorities, and action buttons.
Going Further
Using a Cloudflare Worker as a middleware layer opens up endless possibilities:
-
Routing: Send critical alerts to a “PagerDuty-style” topic and info alerts to a silent log.
-
Resiliency: Implement retry logic if Ntfy API is temporarily unreachable.
-
Deduplication: Use Cloudflare Worker KV to store state and prevent “flapping” alerts (metrics oscillating around a threshold) from spamming your phone.
Security Note: This guide uses the public Ntfy instance. Since topic subscription is open, ensure your topic name is unique and unguessable (like a password). For sensitive business data, always self-host Ntfy or use their authenticated paid plan.